See the circulation
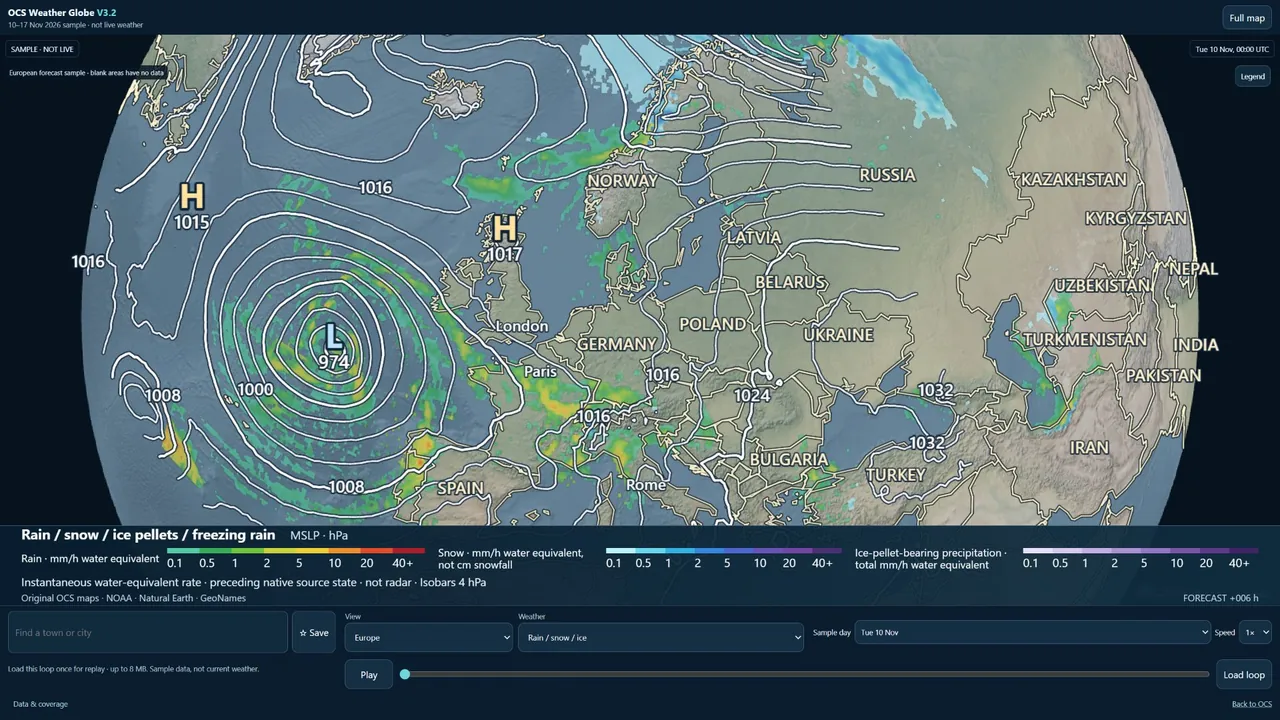
Jet streams steer weather systems, while highs and lows shape wind and precipitation nearer the surface. Follow their relationship from the Atlantic to mainland Europe.
WEATHER GLOBE NOW V3.2
Follow weather systems across oceans and borders on an interactive 3D Earth. Choose a layer, explore a place, and play a forecast to see what changes.
Opens on a simple global pressure chart. Show controls to choose layers or play the forecast. The Globe shows the latest validated hosted run and labels it when an update is overdue.
Dated demonstration · 10–17 November 2026
 Open the latest forecast
Pull back to see how a pressure system crosses the ocean, then zoom in to see where its wind and rain reach land. The same view follows that system across country boundaries and through each forecast time.
Jet streams steer weather systems, while highs and lows shape wind and precipitation nearer the surface. Follow their relationship from the Atlantic to mainland Europe.
Oceans exchange heat and moisture with the atmosphere. Compare what the sea-surface analysis shows with the separately dated atmospheric forecast.
Step through the forecast to see where a band of rain moves, how a low deepens, or when winds shift. Ensemble scenarios help show where different outcomes remain possible.
These tools are in the public V3.2 sample. The available area and date depend on the layer you choose.
Rotate and zoom the Earth, search for towns and cities around the world, or jump to one of 16 preset views. Save a view on the device you’re using.
Follow sea-level pressure and isobars, see wind speed and direction, and switch to 250 hPa winds to trace the jet stream. Gust values are model forecasts. Gust arrows use the model’s near-surface wind direction as a guide.
Switch between precipitation rate and type, 24-hour totals, cloud at different heights, freezing level, and modelled snow depth. Snow depth describes snow on the ground and differs from fresh snowfall.
Explore near-surface temperature and air masses. The ocean view compares sea-surface temperature with its historical baseline. Atmospheric departure layers depend on the matching baseline and source being available.
Choose a day, scrub to a valid time, or play a prepared loop at speeds from ¼× to 4×. Native forecast states are hourly through forecast hour 120 and every three hours after that. Playback can render between source times.
Pressure, winds and precipitation show how systems evolve. Fronts are available only where a matching source is supplied. A separate GEFS outlook illustrates alternative scenarios and spread.
Public sample playback runs in the browser. Downloadable broadcast imagery, video export and external embed licensing are under consideration.
Trace a storm across the Atlantic and see what the pressure map helps explain.
Put a route in regional context. Check a current local forecast and official warnings before deciding whether to go.
Pick a layer and time sequence to explain why the weather is changing.
Plan a forecast segment around a real model run and keep its source and valid time in view. Rights for published graphics are handled separately.
Use the dated example to teach circulation, fronts, and the role the ocean plays in shaping the weather.
Explore where a large-scale weather pattern reaches. Operational decisions still need a suitable current forecast service.
Evaluate the visual approach for on-screen weather explainers. Broadcast use would require a separate licence.
Explore how a future integration could pass forecast data and its provenance to your own application.
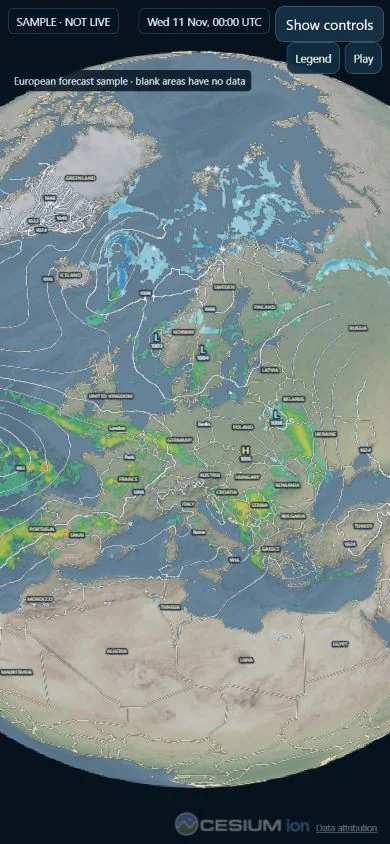
The browser version is available on compatible phones. The Android app is planned.
On a small screen you can switch to Full map, play the forecast and restore the controls when you need them. The browser app needs a compatible WebGL device and a connection for forecast layers.
The proposed Android release would reuse the web globe. Supported devices, installation instructions, account compatibility and any Google Play listing will be confirmed at release.
These integrations are planned. Availability depends on weather-source rights, reliable delivery and access controls.
A documented, authenticated service could return permitted weather values for a place and time, with units, coverage, run and validity metadata.
Scene configurations or approved embedded views could open the globe at a particular location, layer and forecast time.
A future API or Model Context Protocol server could let compatible assistants request authorised values, compare available scenarios and open a view with the source and uncertainty intact.
For a question about forecast wind near a town, a response would identify the model, issue time, valid time, units, and whether the value came from a grid cell or was interpolated. The service would signal missing, stale or out-of-coverage data explicitly.
The dated demonstration is free to use. Subscriptions and commercial licences are in development.
Personal exploration
An entry point for browsing the globe, searching for places and exploring core weather layers.
Regular personal use
Enhanced views and playback, with more ways to save and revisit a forecast.
Advanced enthusiasts and creators
Deeper model exploration and scene tools for building a weather explanation. Publishing rights would be specified separately.
Professional publishing
Licensing tailored to where graphics appear, how often they are used and who uses them.
Application integration
Metered access to approved data and scene tools, subject to dataset rights.
Business licensing
A scoped agreement for branding, usage, support and integration.
A dedicated enquiries address will be listed here once confirmed. Future licences will specify permitted media, territories and source credits.